TOOLS
Structure-from-Motion Photogrammetry

SfM Model of Sinabung Volcano, June 2018 (above), showing UAS image locations (blue squares) and flight path. My UAV (DJI M210) taking off on its way to survey an erupting fissure at Kīlauea Volcano (below).
Structure-from-Motion (SfM) photogrammetry has emerged over the past decade as a powerful tool for visualizing and investigating volcanic processes. SfM solves for the camera location and look angle simultaneously with the geometry of the target, enabling 3D models to be created quickly and cheaply from any set of digital photographs. This greatly improves the accessibility of photogrammetry for volcanic applications, such as building high-resolution digital elevation models (DEMs) to measure topographic change at erupting volcanoes. I have used this technique at multiple volcanoes to measure lava dome growth, lava flow emplacement, and changes in vent morphology. I have also used SfM to create temperature maps and DEMs of thermal areas in Yellowstone National Park to observe changes in thermal features. I primarily use Agisoft Metshape Pro software and have trained others in its use at workshops.
Unoccupied Aircraft Systems (UAS)
Recent advances in consumer unoccupied aircraft systems (UAS, or drones) have created new opportunities for volcanologists to safely observe eruptions from never-before-possible perspectives. UAS images and video are becoming essential tools for mapping and reconnaissance during field work, especially at ongoing eruptions. Aerial photographs from drones are particularly beneficial when paired with SfM photogrammetry, and I am using drone-based visible light and thermal images to study lava dome stability, lava flow emplacement, and the thermophysical properties of volcanic deposits.
UAS also have many potential uses in the exploration of the surfaces of other planets. At the Lunar and Planetary Laboratory, I was the UAS operations lead during a NASA-funded expedition that used the lava field in Holuhraun, Iceland, as a test bed for the utilization of UAS during future missions to Mars.
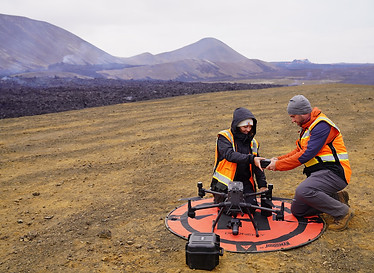
Above: Preparing to launch a DJI M300 for a mapping survey of the active lava flow at Fagradalsfjall during its 2023 eruption, with LPL graduate student Madison Tuohy.
Right: My UAV (DJI M210) taking off on its way to survey an erupting fissure at Kīlauea Volcano during the 2018 LERZ eruption.


Output from the Scoops3D slope stability model (Reid et al. 2000) for Sinabung Volcano showing the calculated Factor of Safety. A FoS < 1 indicates instability and is shown in red.
Numerical Modeling
Numerical models of volcanic processes allow us to explain our observations, simulate potential future eruptions to improve hazard assessment, and test thousands of potential scenarios to better understand specific processes. My modeling work is focused in 3 areas:
-
With colleagues at Arizona State University and INGV Pisa, I apply a 1D, 2-phase, isothermal, numerical model of magma ascent in a volcanic conduit to explain variations in eruptive activity and gain insight into corresponding conduit processes. I am focusing on feedback mechanisms between ascent rate and external processes such as tectonic earthquakes and dome collapse that can lead to transitions between effusive and explosive activity.
-
I use a slope stability model and topography derived from UAS photogrammetric surveys to assess the evolving collapse hazard in lava domes during and after eruptions. At Sinabung Volcano (left, above), I demonstrated that the risk of collapse persisted during periods of relatively low activity and eruptive pauses, when the hazard might otherwise be considered to have decreased.
-
I use multiple lava flow models to investigate the controls on flow advance rate and flow path. Using the 2018 eruption in Kīlauea's Lower East Rift Zone (LERZ) as a case study (left, below), I am testing the ability of models to accurately and quickly reproduce the 2018 flows and identifying the key parameters to tightly constrain to produce a good model. Among these is the input topography, as I have showed that syn-eruptive topographic changes and the resolution of the data can have significant impact on modeled flow path.
GIF showing output from the VolcFlow model (Kelfoun & Vargas, 2015) representing the emplacement of the Fissure 22 flow during the 2018 LERZ eruption of Kīlauea.
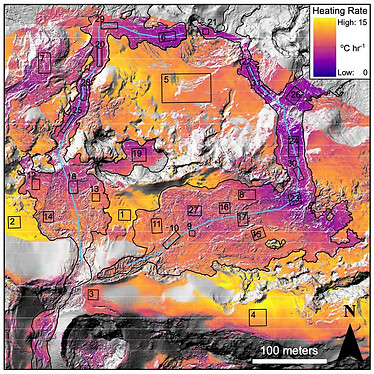
Solar heating rate at Sierra Negra Volcano. Yellow (brighter) pixels are tephra, purple (darker) pixels are ʻaʻā, and intermediate values (orange-purple) are pāhoehoe.
Thermal Remote Sensing
Remote sensing has many applications for observing volcanic activity. Satellite thermal infrared (TIR) images from NASA's MODIS and ASTER instruments allow for qualitative and quantitative documentation of eruption sequences. I use existing methods to convert thermal radiance to eruption rate and have developed a new technique for identifying the type of volcanic activity present in a MODIS thermal anomaly. Knowing both the eruption rate and activity styles allows me to remotely (or retroactively) create a detailed description of an eruption.
I developed a new application which utilizes TIR images from a UAS to calculate the solar heating rate of the surface. Based on physical properties such as density, clast size, and vesicularity, different types of volcanic deposits will heat at different rates under solar radiation. This allows solar heating rate to be used to help identify, classify, and map surface deposits. The spatial relationship and the properties of these deposits then provide insight on the eruption that formed the deposits. At Sierra Negra Volcano (Galápagos Archipelago, Ecuador), I combined the solar heating rate with surface roughness to classify and map tephra and ʻaʻā and pāhoehoe lava morphologies from a recent eruption.
